Simple Map Generator – Introduction
OK so now that we have Amit’s blog post as a general guideline and a Voronoi diagram library , we can start coding. In this post , we’ll just create a nice Voronoi diagram and a 2D visualization of it.
First of all , we need a Voronoi diagram. We’ll throw bunch of points in an area and Bendi’s Voronoi library will calculate the edges between those points for us. And then we’ll create a better and more complicated structure so it’ll be easier to play with it in the future.
var rnd = new Random();
var points = new HashSet<BenTools.Mathematics.Vector>();

for (int i = 0; i < DotCount; i++)
{
    points.Add(new BenTools.Mathematics.Vector(rnd.NextDouble() * MapSize,
    rnd.NextDouble() * MapSize));
}

VoronoiGraph voronoiMap = Fortune.ComputeVoronoiGraph(loadMapParams.Points);
VoronoiGraph is a class from Bendi’s library. It inclused edges and vertices of the voronoi diagram.
Edges have all the data we need so we’ll use them but before that , if you have seen any Voronoi diagrams before , you may ahve noticed that area sizes varies a lot. And since extremely small or big areas looks pretty bad in later stages , I use Lloyd’s algorithm to generate a more “balanced” diagram.
I won’t go into details but in general , all you have to do is to
– generate a voronoi diagram ( using random number for first time )
– take the center points of the areas in that diagram
– regenerate the diagram with those points
– Repeat it as much as you want
After like 3-4 times , you’ll have a much better balanced diagram. If you run it too much , you’ll end up with a grid tho , so be careful. ( There is something wrong with my implementation tho , messing up after like 10 iterations. Oh well , I use 3 anyway. )
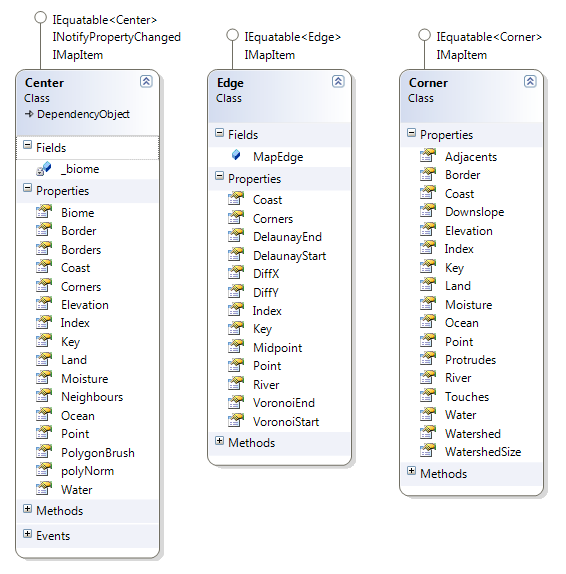
Now we a VoronoiDiagram object but it’s hardly usefull for anything. Sho now we’ll use that diagram object and create a structure pretty close to the one Amit used. We’ll create Centers ( the points we put in ) , Edges ( edges between those points ) and Corners ( where edges connect each other ) and then set some relations between them. For example , center object will have Neighbours ( centers ) , Borders ( edges ) and Corners.
As I said before , VoronoiEdges in VoronoiDiagram object has all the data we need , so we’Ll just iterate through them and get as much data as we can.
foreach (VoronoiEdge edge in voronoiMap.Edges)
{
    Corner c1 = fact.CornerFactory(edge.VVertexA[0], edge.VVertexA[1]);
    Corner c2 = fact.CornerFactory(edge.VVertexB[0], edge.VVertexB[1]);
    Center cntrLeft = fact.CenterFactory(edge.LeftData[0], edge.LeftData[1]);
    Center cntrRight = fact.CenterFactory(edge.RightData[0], edge.RightData[1]);

    c1.AddAdjacent(c2);
    c2.AddAdjacent(c1);

    cntrRight.AddCorner(c1);
    cntrRight.AddCorner(c2);

    cntrLeft.AddCorner(c1);
    cntrLeft.AddCorner(c2);

    Edge e = fact.EdgeFactory(c1, c2, cntrLeft, cntrRight);

    cntrLeft.AddBorder(e);
    cntrRight.AddBorder(e);

    cntrLeft.AddNeighbour(cntrRight);
    cntrRight.AddNeighbour(cntrLeft);

    c1.AddProtrudes(e);
    c2.AddProtrudes(e);
    c1.AddTouches(cntrLeft);
    c1.AddTouches(cntrRight);
    c2.AddTouches(cntrLeft);
    c2.AddTouches(cntrRight);
}
Pretty straight forward I guess? Create Corners , create centers , add a few relations then create the edge and then add that edges relations etc etc. Actually this is probably a lot more detailed than we need but still , it just makes everything easier in later stages.
Oh and by the way , as I mentioned before ; Bendi’s library doesn’t take map borders into account so you have to take care of it before this part. I won’t go into this here , but I added my fix function to the example solution below. It does a decent job but not perfect ( can mess up map corners etc ) so you may want to rewrite that part.
And also ; I’m skipping most of the small details in this post , like ordering area corners for visualization etc. You can find them all in the solution below.
So now we have our organized voronoi diagram but before moving any further , let’s have a look what we have done right? I’ll use an ObservableCollection to hold map items ( centers , edges , corners ) and then a ListBox ( using a Canvas as ItemConainer ) to view those items.
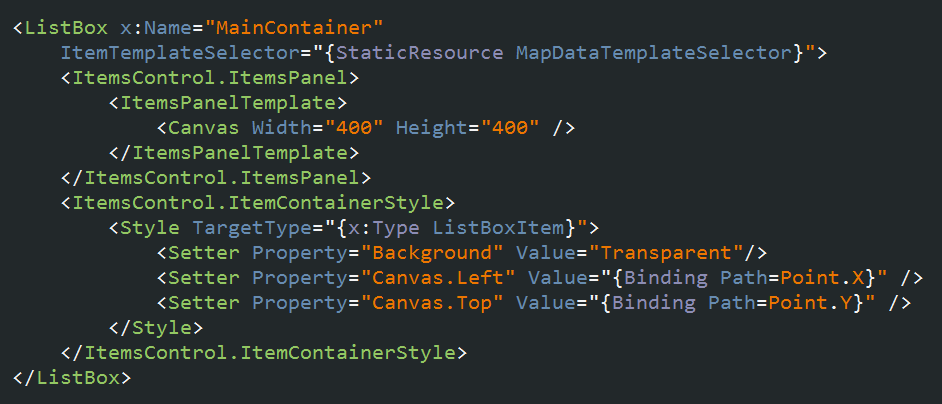
It seems FunnelWeblog doesn’t support XAML in posts. Whatever , now all we need is to create an ObservableCollection , fill it with our items and bind it to that ListBox.
You can find the sample solution below. It only includes the basics I described above and a 2D presentation.
Next , we’ll create the island and stuff.
Visual Studio 2010 Solution